

The Web UI
barca serve serves a web UI at its address: / redirects to /ui/. It shows the same
project, history and cache as the CLI, and its buttons start the same runs as barca get and
barca run on the server. A --read-only server says so once, in a line across the top of every
page, and shows no buttons that would change anything.
Health: what is wrong, and where
Section titled “Health: what is wrong, and where”The Assets page opens on the health of what is open (the project, a group or a file): a map of it beside its causes, then its groups and nodes, worst first.
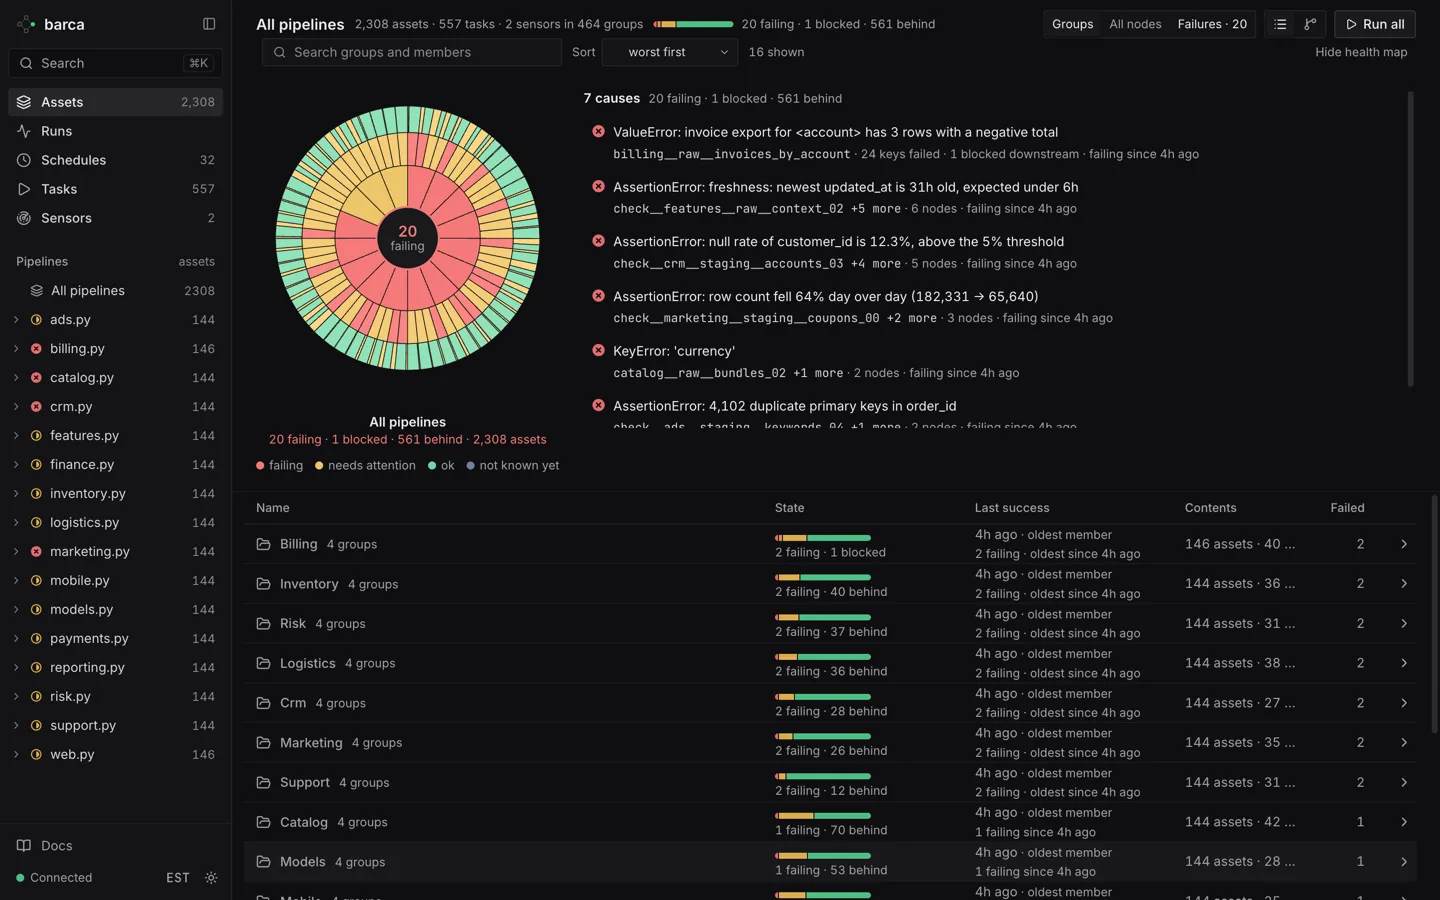 The map’s segments are sized by how many assets are under them and coloured by the worst health inside: red failing, yellow needs attention, green ok; the outer ring shows how many of them are fine. The causes list groups 20 failures into 7 errors.
- The map draws the open scope at its centre, then a ring for each level down: its groups,
their groups, its assets and, for a partitioned asset with room for it, its keys. A segment’s
size is how many assets are under it (a partitioned asset counts once; tasks and sensors
colour their group but take no room). Its colour is the worst health inside: red is failing,
yellow needs attention (blocked, suspect data or behind), green is ok, and grey is what barca
cannot judge yet (waiting, never run). Members too thin to draw one by one become
N smallerbands, one per colour, sized by the assets inside them, so a run of small groups that are mostly fine reads mostly green. A partitioned asset’s keys ring shows its failed, not up to date and ok keys, and a few failed keys stay visible among thousands. The centre holds one number: how many nodes are in the worst health, as the page header counts them. Point at a segment and the line under the map names it, with its path, health and size; click it to open it (the whole page follows), an asset or its keys to select the asset, the centre to go up; hide the map with Hide health map. - Causes list what is wrong once per cause, biggest first: failures that share an error (ignoring its numbers) are one entry, with the keys that failed and how many nodes they keep from running; then output that looks wrong; then what is behind.
Every count the page shows for a scope (its header, a group’s row and panel, a group’s card on the graph, the map) counts the same health per node, so they agree. Each node has one health:
| Health | What it means |
|---|---|
failing |
Its own last attempt failed: a root cause |
blocked |
Something upstream keeps it from being brought up to date: a failing node, which it names |
suspect data |
Its last run succeeded, but the output looks wrong: it wrote 0 rows (a partitioned asset: some keys did), its row count changed by more than half, or it is older than an input |
behind |
Stale, partly computed or out of sync, or a schedule that missed its slot |
undecided |
barca cannot decide yet: a cutoff or sensor upstream has not reported. Expected |
never run |
Nothing recorded |
ok |
Up to date, or a task or sensor whose last run succeeded; also a node barca cannot decide by itself that the last tick found up to date |
The words are barca’s, not the page’s: each node’s health is computed once by barca and is
the same in barca status --json, the server’s API and barca.nodes in barca sql
(Health); the page only draws it.
A node’s panel says what the last tick that checked it found, under its state: checked 3m ago, up to date (or rebuilt, failed, not reached), with the schedule whose tick it was.
That is the tick record, shown as it is on a --read-only server too. Where barca cannot
decide a node’s state without running it (below a cutoff asset that would run, for example),
a check that found it up to date makes it ok until the next tick is overdue
(Last check). Below it the panel names the node’s
refresh path: the schedule whose tick will bring it up to date and when that next fires, with
paused, not firing or the ticks that missed it when the server says so, or no refresh path (Refresh path). For a node that is not
fresh it then says since when it is out of date and either expected fresh about in 3m, the
server’s estimate, or rechecked in 3m where the next tick will look at the node and barca
cannot promise it fresh (Times).
The data signals behind suspect data come from row counts barca records for every tabular
result (Row counts); a node’s panel lists them under its state.
A signal can only be raised for a result whose rows were counted, so the causes of a scope end
with its coverage, for example Data: 7 of 556 measured: an asset that was not measured is
not measured, never fine
(Data signals and coverage).
Finding your way
Section titled “Finding your way”The sidebar holds Search, then Assets, Runs, Schedules, Tasks and Sensors,
then the pipelines (one per source file), then Docs, the connection, the time zone and the
theme. Drag its edge to widen it (or use the arrow keys on the edge; double-click resets it).
Ctrl/Cmd-K opens a command palette that finds assets and partition keys, each with its state,
failing first, and runs what is open. Filters and the open item are in the address, so a link
reopens the same view. Every time is relative (3m ago, in 5m), the exact time on hover.
The Schedules page says when a schedule missed its slot (late by 12m) instead of counting down
to its next one, lists late schedules first, and shows each schedule’s last tick with the status
of the run it started (queued while that run waits for a run slot). Whether a schedule is late
is the server’s answer, the one barca status --json and GET /schedule give
(Scheduling With Cron): the Assets page’s causes and the Schedules page show the
same value.
States
Section titled “States”A node also shows its own state in plain words, with an icon beside its colour: the precise
kind of its health (stale and partial are both behind). The UI and the CLI use different
words for some of them (the UI says fresh where barca status says cached); this is how they
map. The full list of states and their reasons is in
barca status: Cache state.
| Web UI | What it means | barca status |
|---|---|---|
fresh |
Its result matches the current code and inputs; a run serves it from cache | cached |
stale |
It ran before, but its code or an input changed (or its file is gone), so the next run computes it again | stale |
never run |
No successful result is recorded yet | never_run |
waiting |
barca cannot say yet: a cutoff or sensor upstream has not decided | unknown |
failing |
Its last attempt failed, shown with “last good 3h ago” or “never succeeded” | stale with reason failed |
blocked |
A failing node upstream keeps it from running (also through waiting nodes); the row links to that failure |
blocked for partition keys; otherwise worked out in the UI from the graph |
succeeded |
A task or sensor whose last run succeeded (always runs is shown as a property) |
always_runs |
A pinned asset shows pinned beside its version (Pinning and Rollback).
Runs: why they ran, what failed, and running it again
Section titled “Runs: why they ran, what failed, and running it again”The Runs page lists the queue (running runs first, then the waiting ones with how long they have waited; it folds to one line) above the run history. While runs wait, the sidebar shows the queue on every page: how many run and wait, and the oldest wait.
A run’s panel opens with what failed: each failed step, its error and where it raised. Its Run overview says why the run executed what it did, from the reasons barca records when it plans (never run, code or an input changed and which, new partition keys, a forced refresh, a retry of a failure), who asked for it (the API token’s name, and the reason a caller gave), how its attempts relate to its steps, and why it was cancelled when it was (a run that never started names the run it waited behind). While a run is live it shows its progress in steps and keys, what executes now, by group, and an estimate of what is left. Logs and steps render only what is in view, so a run of tens of thousands of steps opens at once; a node’s keys are one row until opened.
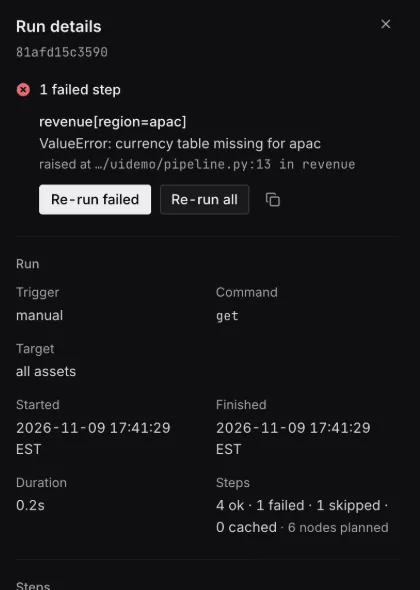 A failed run: the failed key, its error and the line it raised at, with Re-run failed first.
Its actions:
- Re-run failed: the failed steps and everything downstream of them, the same target again, so the steps that succeeded are served from cache.
- Re-run all: the same target with every step recomputed (
--refresh-all). - Retry on one failed step or partition key.
- Copy incident summary: markdown with the run’s link, target, trigger, timing and failed steps.
- Cancel run, for a queued or running run, with a confirmation. A cancelled run does not claim that steps it never recorded were cached or succeeded.
The logs filter by step, by text, and to errors only.
Assets, keys and incidents
Section titled “Assets, keys and incidents”An asset’s panel has tabs: Overview, Data (a preview of its result), History and Incident.
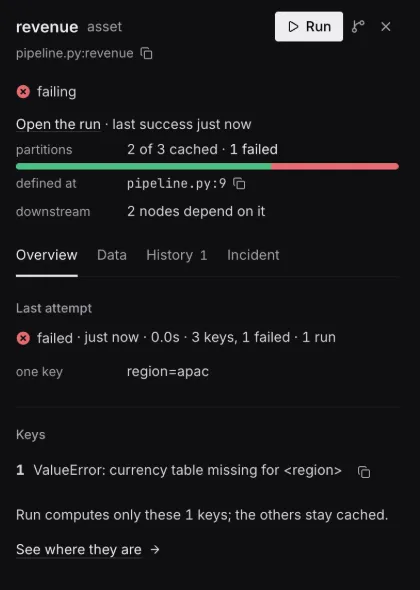 A partitioned asset with one failed key: Run computes only that key; the other two stay cached.
- Incident holds the controls for an incident: pausing and resuming the asset, as
barca pauseandbarca resumedo, and resuming a paused pipeline (Pausing Assets). Uploading replacement data and holding an earlier version are on the asset panel and in the key explorer, asbarca pindoes (Pinning and Rollback). - For a partitioned asset, the key explorer shows every key at once, coloured by state, with each problem as one line (an error and the keys it hit, blocked keys, stale and never-run keys) and a Run button for the keys that are not fresh. See Exploring keys in the web UI.
Connecting to a server with tokens
Section titled “Connecting to a server with tokens”When the server runs with --auth token, the UI asks for a bootstrap code or an API token on its
Connect screen, and API tokens in the sidebar creates and revokes named tokens. The steps are
in Authentication and Tokens.